Home | Projects | CPGE | My carbon footprint
Raman Spectroscopy
Introduction
For large particles, the efficiency of light scattering is proportional to
Of all scattered photons, one in 100 million loses some energy : this is Stokes-Raman scattering, which is inelastic as the molecule stays in an excited vibration state after emission. This weak signal means Raman spectroscopy is usually slower than related techniques.
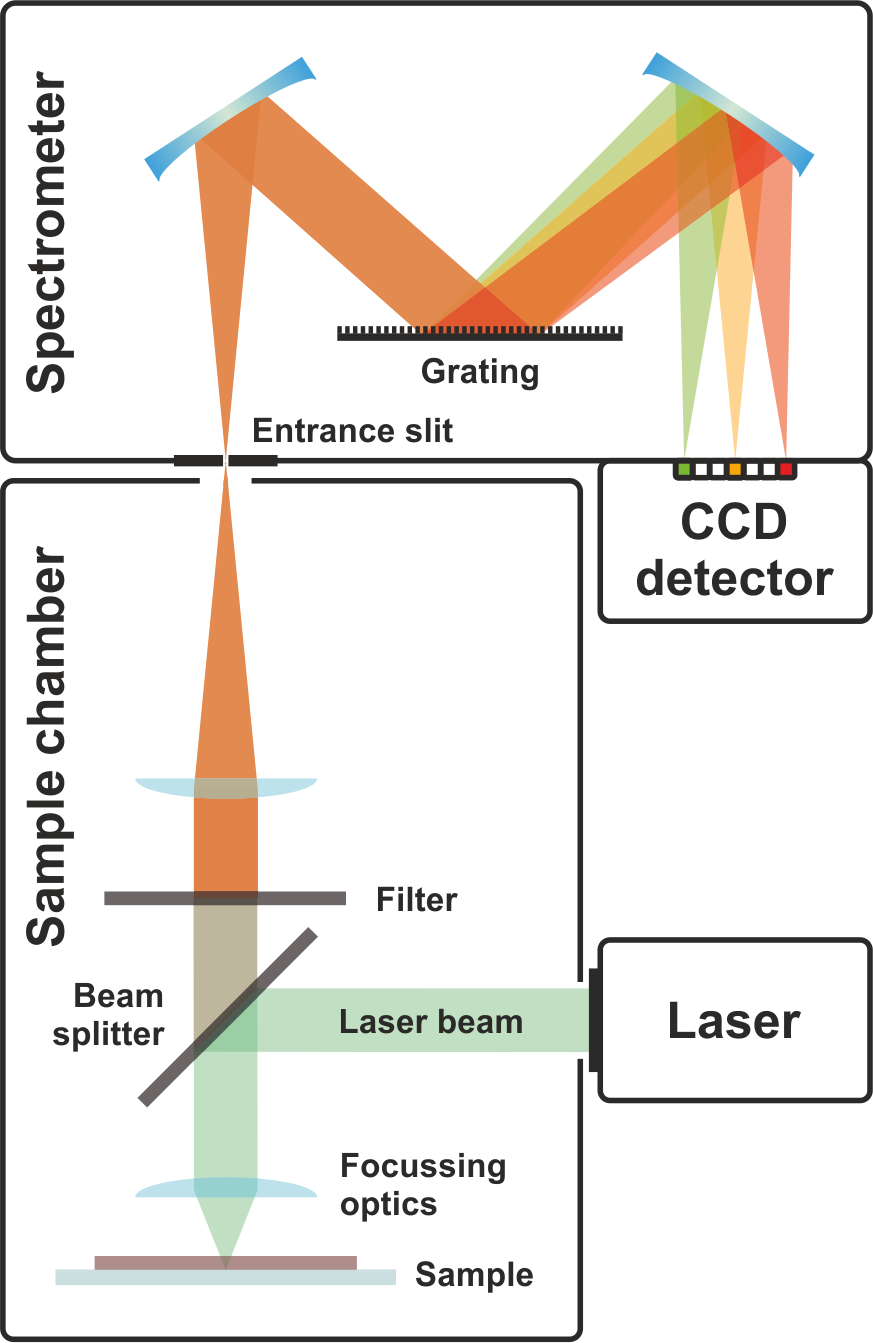
To isolate the in-elastically scattered photons before detection, an optical filter removes photons of the initial (unchanged) wavelength. Then a grating changes photon direction based on
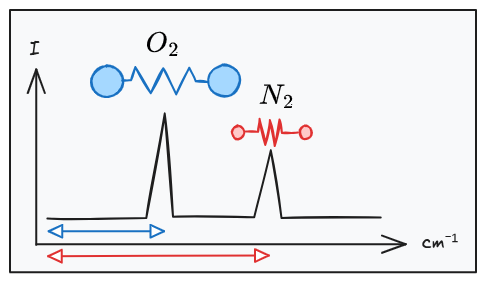
Wave-number is used as a stand in for frequency, with
Differences with IR spectroscopy
IR spectroscopy uses a large incident band of light. Photons of energy
Raman spectroscopy probes the same two states through inelastic scattering, where the incident photon of energy
Raman spectroscopy is often used on polymers, catalysts and various carbon compounds.
Limitations : fluorescence
The main limitation of Raman spectroscopy is fluorescence, which leads to wider and more intense peaks, as many slow inelastic de-excitations via non-radiative transitions take place. This large peak background noise can sometimes be removed in post, as long as it didn't saturate the detector.
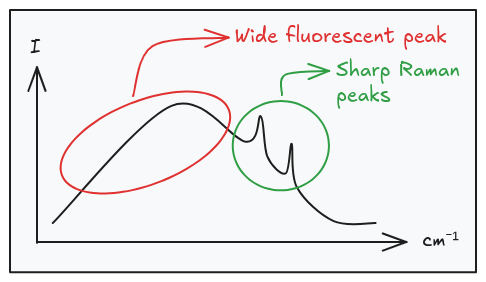
Additionally, the laser wavelength can be changed so there is no fluorescence in the first place. Generally, red lasers are less energetic and therefore cause less parasitic electronic excitations. If the sample is coloured, a laser of the same colour is also less likely to result in fluorescence.
Laser selection in practice
UV or blue light lasers are rarely used, due to the resulting fluorescence explained above.
The CCD detector is limited to below 900 nm, beyond which a generally less sensitive IR detector (e.g. InGaAs) must be used, which affects measurement speed. And, since the scattering is inelastic, the heat generated may darken or burn samples via oxidation or phase changes, more so at longer wavelengths.
Therefore commercial devices are generally in the 450 to 800 nm range. The two typical lasers used are 532 nm (green) (for CNTs with no fluorescence) and 785 nm (red) (for coloured or organic samples).
To avoid burning samples, Neutral Density (ND) filters are used to decrease incident laser power. Additionally, laser intensity (power/area) must be evaluated the effect of beam size. Finally, consecutive analysed points can be chosen in random distant position, to avoid localised heating.
To check for sample damage, take two identical sample measurements and verify that peak intensity and position remain unchanged. Initially, trial and error via gradually increasing power allows for an ideal selection.
Sensitivity and combination with optical microscopes
By Toommm - Own work, CC BY 4.0, Link
If we focus the laser via microscope lenses, the Raman measurement becomes highly localised ( limited by diffraction around
Usually, only back-scattered photons are collected, by collecting them through the same lens. The numerical aperture of the latter describes the range of angles of light it can collect :
For isotropic Raman scattering, the geometrical collection efficiency is set by the solid angle collected by the objective
The efficiency of the CCD detector is limited by its Quantum Efficiency (QE) of photon to electron conversion, which ranges from 0.5 to 0.9. It's also has a noise floor, composed of shot noise (SN) (proportional to the root of the signal), dark noise (DN) (signal in absence of light), and read noise (RN) (from the electronics). Raman peaks less intense than this floor won't be detected.
Total noise is
Resolution versus Sensitivity
Real peaks aren't zero-width but Gaussian, with a width around 10 cm⁻¹. Resolution can be increased by decreasing slit width and/or increasing the line density of the grating (in lines/mm, usually around 1000). However both decrease sensitivity, as less light reaches individual CCD pixels.
For the wavelength of one specific laser, the 100-2000 cm⁻¹ spectral range is the identifying "finger print" region. Additionally, a wide C-H and N-H stretching band can appear up to 3500 cm⁻¹, usually around 3000 cm⁻¹ for organic samples.
Therefore, the grating must project this specific spectral range onto the detector for the specific laser used. Higher line density means a narrower range is observed. If swapping gratings, compressed air can be used to clean it, but not any solvent or wiping. (X-axis) calibration uses a reference lamp of known wavelengths (Neon, Argon, Mercury...) and measures where they land on the CCD detector.
Beware : using a moving average window (convolution) will reduce noise, but peaks become broader and less intense.
Further reading
Use cases
The signal is sensitive to the layer structure : therefore Raman spectroscopy can be used to distinguish 1, 2 or 3 layer graphene.
Heavy water has a different vibration state to regular water, and can therefore be distinguished from it via Raman Spectroscopy.
Surface-Enhanced Raman Scattering (SERS) use resonant Au nanoparticles to increase signal sensitivity.
Galvano optics (rotating mirror instead of sliding sample) allows for easier high precision random point sequence measurements to avoid sample heating without rapidly movement of the sample. This is especially important for sensitive operando measurements.
Multiplexing
Neutral density filters may decrease incident power by factors of 100. Instead, 100 points of a surface could be studied in parallel, and observed on a 2D CCD detector surface.
Since wave number is no longer read along the x-axis, a tunable band pass filter can be used to access spectral data. Another option using a Michelson Interferometer, like in FT-Raman. Otherwise, fiber bundles can be used, though their spatial resolution (number of points/area) is limited.
The best compromise is often measuring along a line instead of an area, and using a 2D CCD sensor. Thus, wave numbers are separated along the y-axis.
Supplementary Information
| OBJ | F.O.V. ( |
|---|---|
| 5x | 1600 |
| 10x | 800 |
| 20x | 400 |
| 50x | 160 |
| 100x | 80 |
Sources :
- Bruker Raman for Beginners video series
- LibreTexts Chemistry : 4.3: Raman Spectroscopy
- Basic Introduction to Raman Spectroscopy (Part I: Fundamentals), Vincent Meunier
- Basic Introduction to Raman Spectroscopy (Part II, applications), Vincent Meunier