Home | Projects | CPGE | My carbon footprint
Electrochemical impedance spectroscopy (EIS)
Electrochemical impedance spectroscopy (EIS) is a characterization technique for an electrochemical system (battery, electrolyzer, fuel cell) that consists of applying a low-amplitude alternating signal to the electrochemical system and measuring its response at different frequencies.
This marks a swap from the time domain (cyclic voltametry etc) to the frequency domain, where slow processes can be probed at low frequencies, and fast processes can be probed at high frequencies. The practical frequency range used with most of the commercially available electrochemical analysers can be from 1 μHz to 1 MHz.
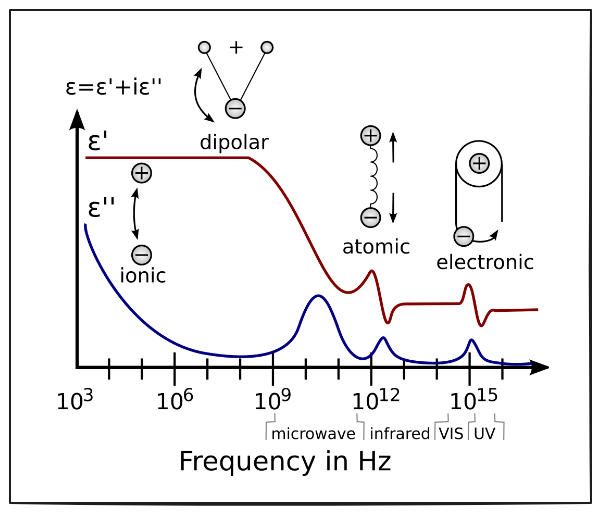
Fig. 1 : Imaginary and real response to EIS excitation (Wikipedia)
System response to a certain perturbation is governed by three processes each with their different characteristic time constant (given in orders of magnitude):
- charging/discharging of the electric double layer at the electrode/electrolyte interface : 0.01 ms (1 kHz)
- kinetics of the redox reaction : 1 ms (500 Hz)
- diffusion of the redox species from the bulk solution to the electrode surface : 1 s (1 Hz)
Preliminary information
Principle of the method
A potential
- Potentiostatic EIS: V(t) is imposed in order to measure i(t)
- Galvanostatic EIS: i(t) is imposed in order to measure V(t)
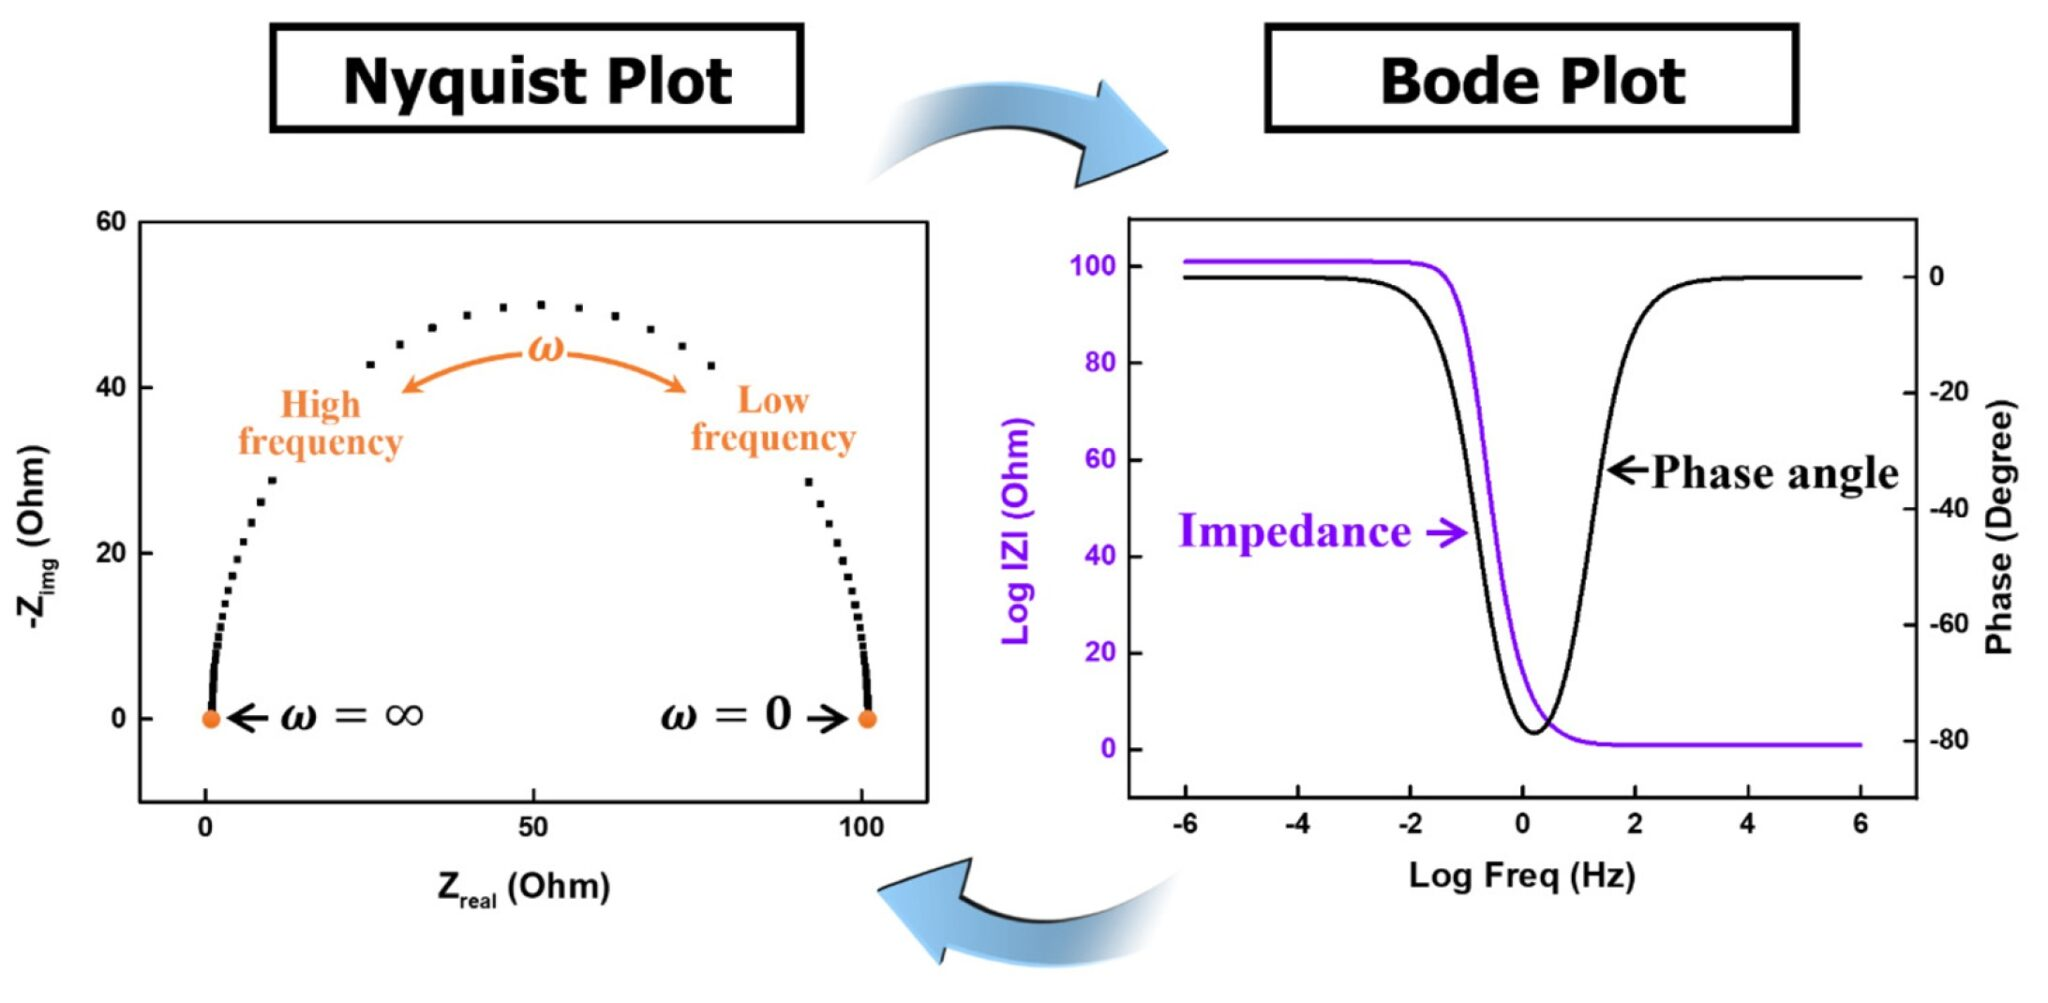
The impedance
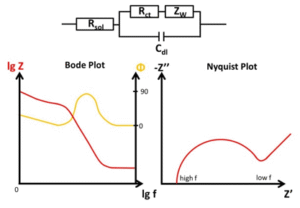
- Bode plot -> 2 graphs, the amplitude and then the phase angle as a function of frequency
In polar coordinates,
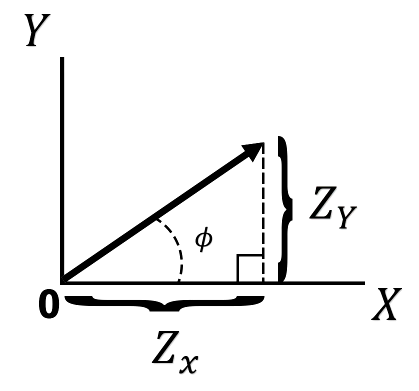
Fig.: Impedance plot in Cartesian coordinates
- Nyquist plot -> impedance magnitude
and phase angle as a function of the imposed frequency
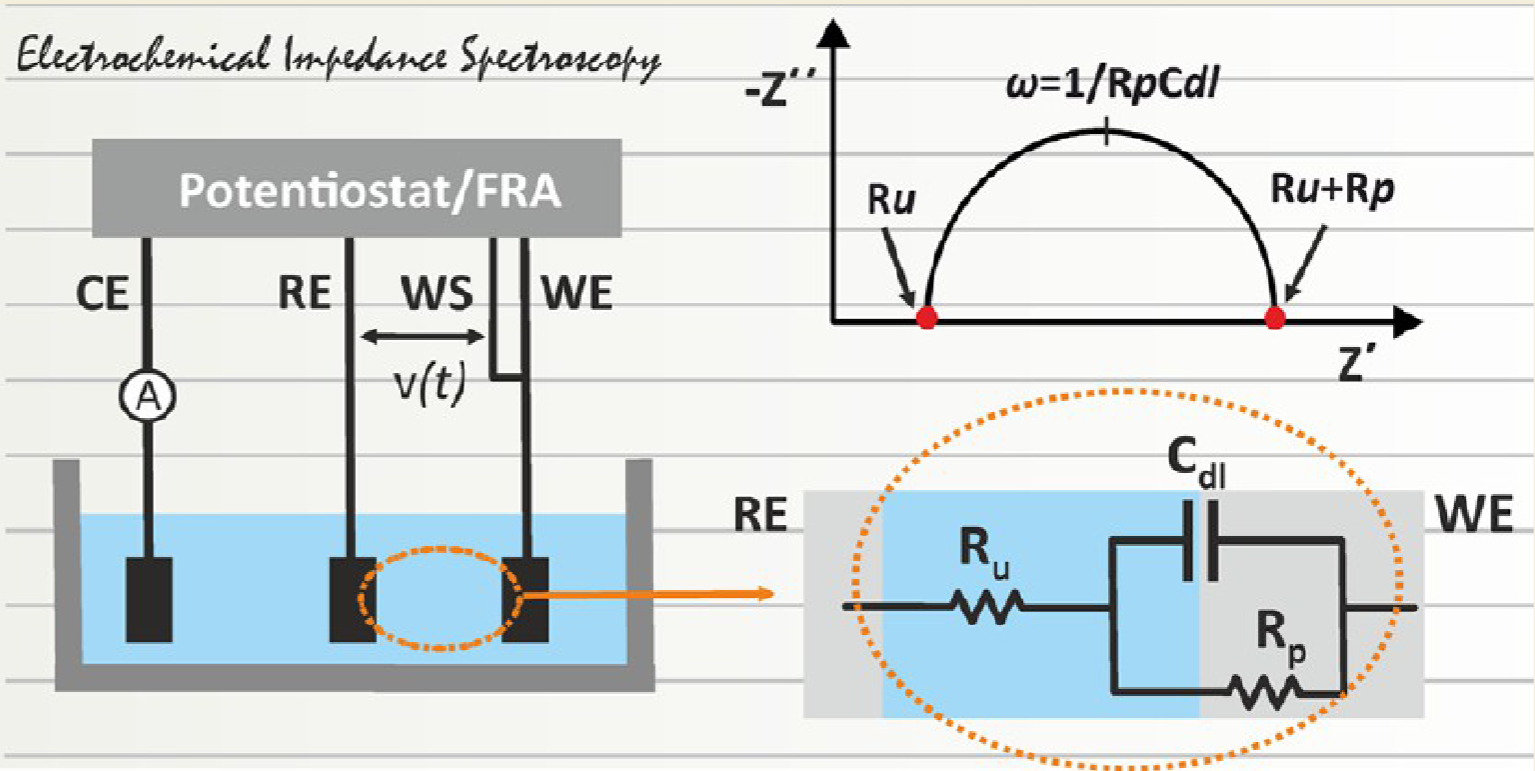
This makes it possible to build an electrical model (circuit), then perform fitting to determine the values of the components (see this fitting site)
A few principles and orders of magnitude
- Double-layer charging time: microsecond
- Characteristic ionic diffusion time: hundreds of milliseconds
- At low frequency, higher-impedance processes are generally observed, such as ionic diffusion
- In the spectrum, the anodic reaction should correspond to low frequencies, because the HER:
is the kinetically limiting (slow) reaction
Warburg impedance
Associated with diffusion, this regime is characterized by a 45° line in the Nyquist plot, which means that the charge carriers move at a constant speed. This can be rationalized as follows:
- Real impedance = diffusion distance in the oxide layer,
- Imaginary impedance = delay required for ion diffusion (through the oxide layer)
So if the ratio
Sources: