Home | Projects | CPGE | My carbon footprint
Protocol : H-cell polybromide shuttling quantification
Safety : all experiments are to be undertaken with appropriate PPE and under a fume hood due to the risks associated even with trace amounts of bromine gas.
Calibration spectrum
First of all, it is necessary to create a spectroscopy calibration spectrum for complexed bromine first using different concentrations in the ZBRB electrolyte. For this a three electrode setup is required to generate the MEP-
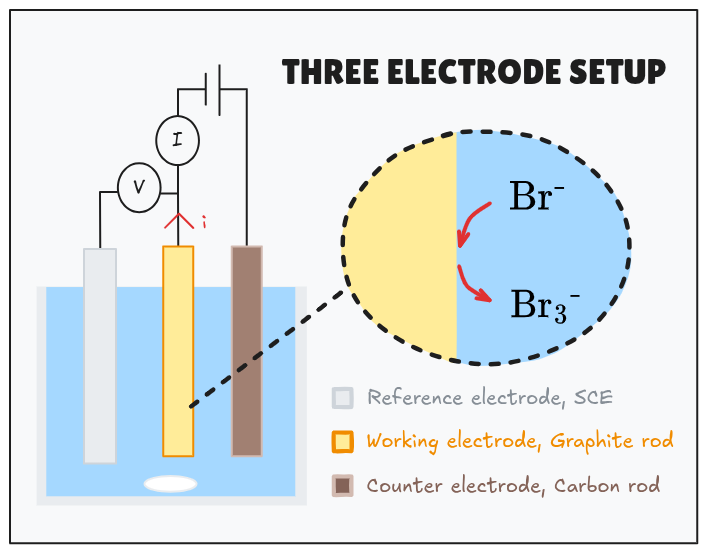
The total reference oxidised bromine concentration can be calculated via Faraday's law. Via UV-vis spectrometry we can identify
To characterise very dilute amounts of polybromide species, the two extreme oxidised bromine concentrations shall be 10⁻⁸ and 10⁻⁵ molar. The total time necessary to create the calibration spectrum must be reasonable. Therefore we chose
| 1 A | 0.01 A | ||
|---|---|---|---|
| 10⁻⁵ s | 0.1 s | 1 s | |
| 1 s | 192 s | 16 min |
Table : approximate electrolysis times for extreme bromine concentrations depending on
The total analysis time is 48.6 min, not including the time to replace the electrolyte between samples, so in total around an hour. Initial solutions sampled in spectroscopy cuvettes can be analysed once the electrolysis time is more significant, as complexed polybromides are stable.
The electrolysis times are as follows :
| 1.000e-08 | 1.009e-06 | 2.008e-06 | 3.007e-06 | 4.006e-06 | |
|---|---|---|---|---|---|
| 0.9649 | 97.3537 | 193.7426 | 290.1314 | 386.5203 |
| 5.005e-06 | 6.004e-06 | 7.003e-06 | 8.002e-06 | 9.001e-06 | 1.000e-05 |
|---|---|---|---|---|---|
| 482.9091 | 579.298 | 675.6868 | 772.0757 | 868.4646 | 964.8534 |
The following python code shall be used to determine the slope a of Beer Lambert's law :
import numpy as np

import matplotlib.pyplot as plt

from scipy import stats

#import scipy.integrate as integrate


#from matplotlib.lines import Line2D #what is this for again?

import scienceplots

import pylatex


## Constants

V_sol=1 #L à vérifier avec précision? vérser le volume dans la cellule avec précision

lamda1=275 #nm

lambda2=390 #nm

I0=10**(-3) # A

F = 96485.3415 #s A / mol


## Calibration range values

n_polyBr=np.linspace(10**(-8), 10**(-5), 11)

print("Moles of polybromine are", n_polyBr)

print("\n")


C_polyBr=n_polyBr/V_sol


times=[] # s

for x in n_polyBr:

times.append(x*F/I0)


times_rounded = [ round(x, 4) for x in times ]

print("Times in s are", times_rounded)


## Experimental

A_Br2=np.array([1,1,1,1,1,1,1,1,1,1,1])

A_Br3=np.array([0.001,0.005,0.01,0.017,0.021,0.027,0.035,0.039,0.0445,0.051,0.055])


#A_relatif=A_Br3/A_Br2


#############################################################################

## Linear regression


x = np.asarray(C_polyBr, dtype=float)

y = np.asarray(A_Br3, dtype=float)

a = np.dot(x, y) / np.dot(x, x) # slope for A = a*C


#############################################################################


## Plotting absorbance


plt.style.use(['science', 'ieee'])

plt.scatter(C_polyBr, A_Br3)

plt.plot(C_polyBr, a * C_polyBr, color='red', label='Regression Line') #plot instead of scatter for line


plt.title("Calibration Curve")

plt.xlabel("[Polybromine species] (M)")

plt.ylabel("Absorbance")

plt.grid(True)

plt.xlim(xmin=0)

plt.ylim(ymin=0)

plt.legend(fontsize=6.5)

plt.show()
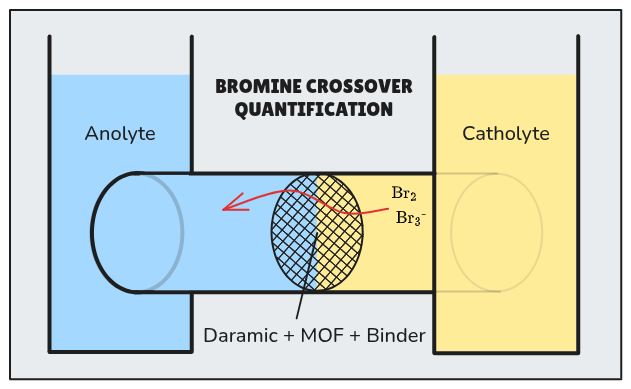
Polybromide shuttling evaluation
Using a two-compartment diffusion cell with crossover surface area known accurately, compare bromine cross over for the following separators :
- bare Daramic
- Nafion/ethanol sprayed on Daramic
- bare ZIF-CP (based on zinc nitrate and imidazole)
- ZIF-CP bound to the Daramic surface
- At this time time unsure as to how to bind them
Anolyte is prepared according to the ZBRB electrolyte protocol, and so too for the catholyte but with the inclusion of the MEP binding agent.
Procedure
- Install membrane with attention to coating orientation, as MOF coating should be on the anolyte side
- Sample anolyte side after 0,
, 1, 2, 4, 8 and 24 hours - Replace sampled volume with fresh receiver electrolyte if necessary depending on total electrolyte volume in cell
Analysis
Quantify bromine crossover by UV-vis of polybromide using reference spectrum.
Calculate :
- cumulative crossover
- steady-state flux in mol per square centimeter per hour of polybromides